Oculus

My Process
Competitor and SWOT Analysis:
From my research, the SWOT, and Competitor analysis I learned that even though Oculus is amazing there is still room for improvement. I learned from the SWOT analysis that Oculus has a double edge blade in its arsenal, and that is Facebook. It is Oculus’ biggest strength and weakness depending on the user. As a strength, Facebook has let Oculus develop into one of the cheapest and best value-for-your-money products but its affiliation with Facebook is what deters many in the VR gaming space to buy it as many have issues with how Facebook sells their customer’s data, and privacy breaches like from Cambridge Analytica scandal. Oculus requires its user base to log in to Facebook to use its product which many hate being forced to do. VR gaming is still very new and the people who know all about it and the people who would recommend or educate others about it, are tech nerds who care about privacy and their data being sold. These are the people who spread the news by word of mouth, and these are individuals who others are more inclined to take advice from. On the technical side Oculus also has one big problem as well and that is that it has a short battery life which is a big turn-off to gamers. On the positive side, it is completely wireless and allows for wired play as well if you want to access the Steam PC game library. Part of the reason why it was able to be so much cheaper than its competitors is that Facebook can sell the user data and still make profits, and they can get it to more hands because of its cheaper price and make profits in the long run from people buying from their store as well. Its cost is also cheaper than competitors because the Oculus Quest 2 doesn’t offer many features that competitors offer like built-in headphones with premium audio, 5k display, and higher display refresh rates. Oculus is marketing their product to the average consumer by making it so affordable that it compares with someone who is in the market to buy a gaming console price range. Whereas the competitors are marketing to the most die-hard gaming enthusiasts who are willing to pay such high prices for the premium quality and experience those devices provide. Oculus before it was bought by Facebook had the support of PC gamers and it seems like Facebook is trying to win the approval of the average consumer who might not care about their data being mined and sold by making VR gaming more affordable and letting more people have an opportunity to experience virtual reality gaming. Oculus’s biggest strength compared to its competitors is that it’s cheap, wireless or wired to work with PC . So far it looks like Oculus is doing great price-wise but it can use some help with its original gaming library and consumer trust.
Here is the excel spreadsheet for the Competitor and SWOT Analysis.
Target Audience and Personas:
After conducting some research from a data analytics website called SimilarWeb, I found enough info to create a persona based of that data. All this info from SimilarWeb really fits with my persona and matches everything from my research. It helped me understand my demographics more and what their interests might be. I was also able to see what social media platform the most traffic came from and probably where my user base probably learned about Oculus. More than 50% of the social media traffic came from Facebook but that was no surprise to me since they own Oculus. Surprisingly YouTube was the second largest beating Reddit and Twitter. I was surprised to see LinkedIn in the list because that didn’t seem like it fit with this but their was .43% from the total 10.06 social traffic. SimilarWeb really help solidify what i thought my personas interests would fall into and what location they were going to be and how I was going to name them from the SimilarWeb data. In SimilarWeb it showed that my main audience was from America, Japan, Canada, UK, and South Korea. So I made my persona a Asian-American with a American, Japanese, and Korean name. American first name, Japanese middle name and a Korean last name. My personas background is that he is an American born from a Korean father and a Japanese mother and thus resulting in his name.
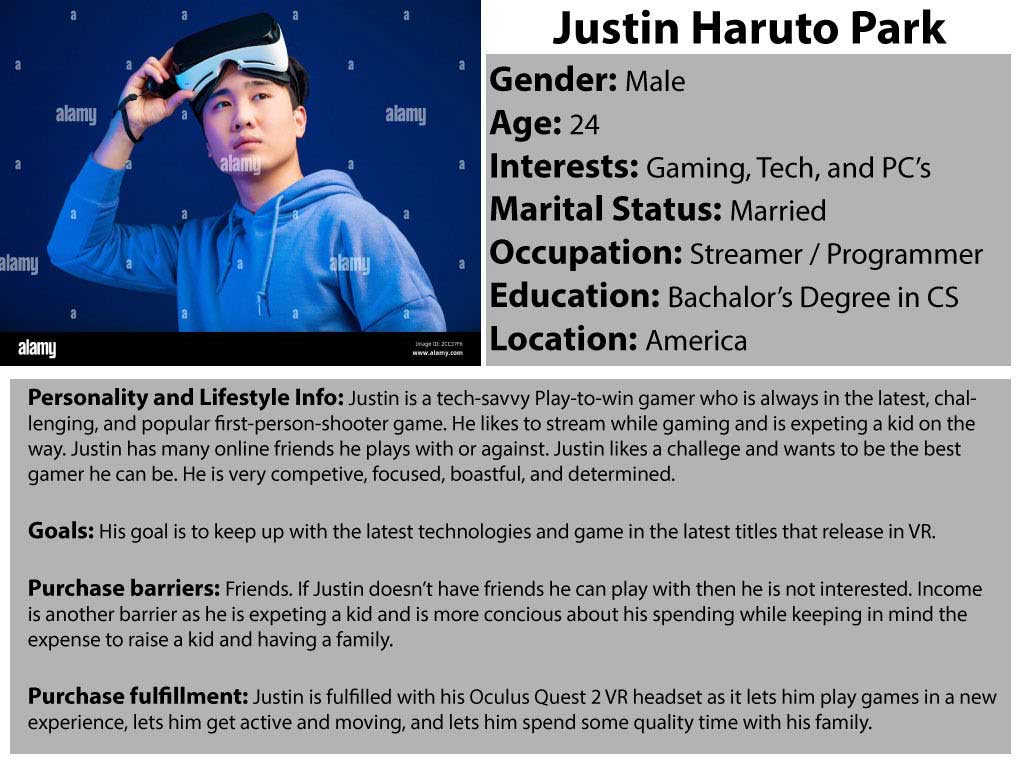
Here is the PDF for the Target Audience and Personas for which I am basing my Persona Justin from.
Analytics and Metrics:
Part 1:
For Oculus I think these five KPI’s or key performance indicators seem to be the most important to measure. The KPI’s I have chosen are traffic sources, bounce rate, exit page, conversion rate, and time on site. I believe these five to hold the most impact and thus chose these five to focus on. Two conversion tests I would recommend to use are prominent contact information and combining scarcity and urgency with promo code countdown timers. These two combined I think would generate more conversion for Oculus as users would feel more trust and urgency with a limited-time promo code countdown timer to make them get quick on the deal and make that purchase. I know that timer had gotten me a couple of times, so I am sure it would work with this as well.
1. Traffic Sources:
Traffic sources is data about where your sites traffic or visitors are coming from.They can come from organic traffic that is traffic via a search engine or direct traffic which is when someone just enters your URL directly and referral traffic which is when you get traffic from another site via a link or ad. I consider this a key performance indicator because this data can show me where my marketing efforts are paying off, where it needs work, and new places where I can invest in marketing to reach more people. It may tell me where to focus more and where I may not need to maximize my efforts. With this data I can pinpoint what I need to tweak or improve, for example if I see that my organic traffic is low or not reaching my goals then I probably need to more better on my search engine optimization so I can reach my projections, or if I notice I get more traffic from a certain site on holiday or some special event I can tweak my marketing campaign more to that audience and site to maximize traffic.
2. Bounce Rate:
Bounce rate is the percentage of people that leave after entering the site. This happens because the user didn’t find, see, or care for what they visited the site for. I see this as a key performance indicator because this shows me what pages are not performing well and needs to be improved to make my page more sticky. This may tell me that my content or design isn’t meeting what the user was expecting. So, with this data I might change graphics or shorten long text that might scare users away and make things more simple or make more relevant information stand out more or update information if it seems outdated. I would add more or tweak to improve the stickiness of the page to try to get the user interested and engaged.
3. Exit page:
Exit page tells me where the user exited the site. This can high on receipt or thank you pages which is normal but can bad if it is on other pages. I consider this a key performance indicator because it can tell me where there might be bugs on a site make the user leave and go somewhere else because something isn’t working properly or something that caused the user to lose interests. Using this data, I might be able to pinpoint bugs like a page not showing up correctly or might see that a user was ready to buy a product but when they went to the checkout page got hesitant and left. That might tell me Hey the user was happy with the product but didn’t like our checkout process, payment options, or extra fee’s that may apply and something I need to work on to improve. I may need to add more payment options or see if there is some glitch or bug preventing the user to from getting what they came for, or if my checkout process is too much work because they didn’t want to create an account or because they forgot their login information and lost interest or load times being too long and causing them to go somewhere else.
4. Conversion Rate:
This is the percentage of customers that have completed a desired objective.For Oculus that would be getting a user to buy something from the store like a VR headset. I consider this a key performance indicator because every site was created to make the user get something out of it, that why the site was created right? So, this is the most important for Oculus as their main objective is to entice the user to buying a VR headset, games, and accessories. So if I have high conversion rate then that means I doing a great job giving my users what they want and reaching the right people, if I have a low conversion rate that that means I’m doing something wrong like not meeting or enticing the right crowd or my solution or product isn’t meeting peoples demand. This is the most important KPI because this displays the success or failure of your business, content, and target audience. So, if I have a good conversion rate then that means I need to maximize and tweak the efficiency that I am operating in to reach more people and it might mean I can look and focus on reaching other venues to reach more people but if it is low than I would have to change the game plan and rethink my business model and figure out where I went wrong and fix it quick. In order to do this, I would look at my other KPI’s and see where else I am performing poorly and conduct surveys to get idea of what my visitors are thinking so I can accommodate them more.
5. Time on site:
This is how long a user will stay on your site. Basically, this shows how much interests the user may have from your content or what you have to offer and shows how sticky your content and design are. This is an important KPI because this shows the stickiness of your site gives you an idea of how much a user may have interest in something you offer. Using this data, you can get an idea of what works and what doesn’t and keep up the good stuff and improve on and throwaway or improve the more poorly performing stuff that people don’t care for as much. So, for example if I am offering a product in many colors or designs and see that people are only spending time looking at one design and reading all about that but doesn’t care for the other stuff, I might want to focus production, designs, and color scheme of that product for the new version or marketing campaign for that product than the more poorly performing one. If one of my products are not performing well on this metric than that means I missed the mark and need understand why so this doesn’t happen again and learned and improve.
Part 2: Analytical Software
I have researched and found two solutions to Oculus for analytical software recommendations. The two I found where Google Analytics with tag manager because it is free, is the most widely used, and has many features one may need without a paywall. However, if the paywall isn’t something that matters than I would also suggest using Google 360 if you are going to have large volumes. Google analytics is free, it has visitor tracking, user behavior, conversion tracking, a robust set of free tools, traffic sources, raw data, multi-user functionality, and user pathing and flows. The drawbacks are custom even tracking, not seeing organic search keywords used, can be challenging for new users, and the free version doesn’t have accurate cookie reporting, only sampling. With Google Analytics Tab Manager you can customize your experience by running tracking codes on tags and creating a custom experience. Tab Manager is also free. Now with Google analytics 360 you can get deeper analysis because of the machine learning software it has integrated with it and lets you work with higher volumes of data limits compared to the free version. 360 also lets you access a lot more customization. 360 is very pricey starting at $150k per a year up to 500 million hits per a month and will increase if you surpass the hit limit every $100 million hits above the 500 million start.
Adobe Analytics is the alternative to Google Analytics as a enterprise level software. They use machine learning, artificial intelligence, and other modern technology to provide industry leading web analytics. Adobe isn’t free like Google and can vary on costs depending on how many hits your site gets. Prices can start from $100k to $350k+ per a year. So, this will be only useful for very large enterprises with high data volumes. One must get a quote to get their price points from Adobe. “Adobe Analytics allows you to track digital marketing campaigns and their performances, recognize and create different types of data segments for re-marketing, offer a customized shopping experience to your site visitors, and works with bare-minimum data latency, particularly during the periods of peak traffic activity and lets you do a lot more.” (rawsoft). Adobe can do the same tracking as google but can be more tailored to your business. The drawback is Adobe isn’t easy to implement and requires professional to install it and user support and training is a problem.
References:
- trust radius. (n.d.). Pros and cons of Adobe Analytics 2021 – Trustradius. Adobe Analytics Reviews. Retrieved November 3, 2021, from https://www.trustradius.com/products/adobe-analytics/reviews?qs=pros-and-cons.
- A quick comparative review of Adobe Analytics Cloud Vs … A Quick Comparative Review of Adobe Analytics Cloud vs Google Analytics 360. (n.d.). Retrieved November 3, 2021, from https://www.rawsoft.com/blog/adobe-analytics-cloud-vs-google-analytics-360/.
- Google analytics vs google analytics 360: 4 critical … Google Analytics vs Google Analytics 360: 4 Critical Differences. (n.d.). Retrieved November 3, 2021, from https://hevodata.com/learn/google-analytics-vs-google-analytics-360/.
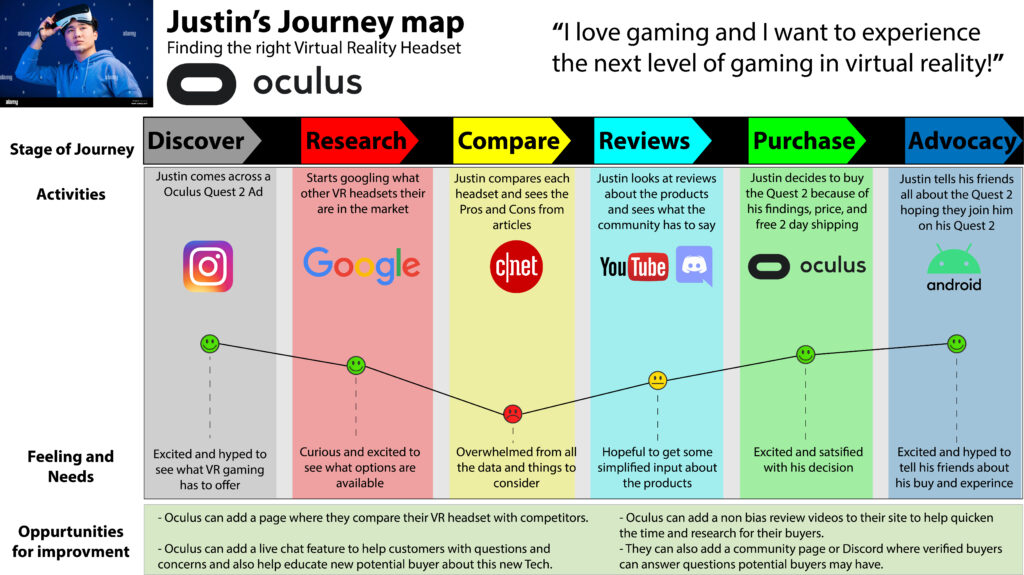
During the process of creating this journey map I had to figure out how I would or have come across Oculus and the steps I took to see if it was for me or my persona. I followed the steps I and other tech geeks like me usually take when making a big tech purchase and that is researching what’s in the market, comparing products you find that meet your criteria, comparing the pros and cons of the products, and finally deciding which one fits the most criteria’s. I assume my persona would follow the same logical steps that I would, and I took those same steps as I was completing the map to see what pops up and what routes one would take from the options that appear. I also documented what emotions I felt and what others like my friends and family feel when they go through theses kinds of process or stages in buying a product online. As for the Journey map when initially starting it I was trying to figure out how I should setup the layout and followed what I thought was the was simple and easy to follow example you provide in the assignment details. I went with the simple and easy to follow route because the journey map should be something that you can easily follow and understand the steps a person went through and felt during that buying process and I felt that with this layout. The others felt like there was too much going on and I felt like they could have been more simplified. After figuring out how I wanted to setup the layout, I had to figure out how I wanted to design the layout like colors, alignment, and spacing. Then I started to plugin all the data I had
gathered from following the steps a person would actually take to buying an expensive tech product. I started with saying how my persona discovered the Oculus VR headset from Instagram as that was one of the most prevalent places I first came across Oculus myself. Then I just followed the steps I took and plugged in the rest of the data. While I was gathering data I also came up with some improvements Oculus could have taken to make this whole process better like having live chat, having a Discord for community questions, and having a comparison of their VR headset with competitors like HTC, and Valve. Also a non-bias review from a popular review from Youtube would have been nice to see. I also pointed out the pain-points of having to go through and compare so many options especially prevalent with tech like hardware, features, and price points. I figured anyone following my steps would run into the same overwhelming feeling during this process.
Here is the PDF for the Empathy Map, Keyword Research and Body Copy for which helped me make the journey map.
Multi-Channel Marketing and Social Media:
Part 1:
For my proposal for my marketing campaign, I am thinking about following the Xbox All Access program and Game Pass as something I can follow for Oculus’s new service. Xbox All access is a program where after you get a credit check and get approved you can get the latest Xbox with their gaming library subscription for 24 months and payoff that console plus subscription in a monthly payment for 24 months or 36 months. Oculus doesn’t have a game library subscription like Xbox does with its Xbox Game Pass, so I would my idea is to create Oculus’ game library subscription called Oculus Gamerverse. Gamerverse will cost users $10/month. Since Oculus already has a game library subscription and their company’s mission is to get VR to as many people as possible, I think it would be in Oculus’ best interest to also integrate this kind of service to its business model. Since Oculus is already aggressively competing with its competitors with its much cheaper VR or virtual reality headset by making the cost of one $300 instead of the price point near $1000 like its competitors, I figured we can grab a hold of more consumers with an even affordable solution to get more customers. So, my solution is to start a program called “Quest to Success” which would give customers the opportunity to get the Oculus Quest 2 VR headset bundled up with the Oculus Game library game subscription called Gamerverse make payments for 24 to 36 months if approved with a credit check. Consumers can get the bundled deal from the Oculus site in free 2-day shipping which Oculus already offers with a purchase of a Quest 2. This will also be extended to Oculus’ channels like Best Buy, Amazon, and Newegg with goal of free 2-day shipping but whatever the Brick-in-Motor store or online site can provide for shipping. We will use these channels like emails, Facebook, and Instagram since like Oculus they are own by Facebook and this will allow us to get more data on KPI’s more directly, efficiently, and quicker. We will also use channels like Best Buy, Amazon, Newegg because these are channels where consumers are already familiar with when purchasing tech, convenience to our user-base, ability to deliver and reach our user-base, and because Oculus has already built an relationship with these channels from Oculus’ previous marketing and product distribution. Upon success of the campaign Oculus will follow the path Xbox took with their Game Pass subscription which is buying triple A game development companies and providing users with more content to enjoy, bringing brand-new triple A titles releases to the Oculus Gamerverse on the same day of the release, and enticing more customers to join with its newer vast game library and game options. Upon its success Oculus will also create more triple A Oculus original tittles and people with Oculus Gamerverse subscriptions can enjoy those titles on the day of release. Doing this will allow Oculus to be more competitive with its VR competitors and its console competitors like Xbox, PlayStation, and Nintendo while allowing newer customers who have a more limited disposable income than previous Oculus buyers to join the platform, creating value for customers, creating a community within Oculus and its gaming subscription, and allow Oculus to reach the hands of many more people like its business model was designed to do. Subscribers can have the option to fill out surveys of what content they wish to see, what they don’t, and what improvements or slice of life improvements they want to see. This also allows more actual gamers to get their hands on the VR headset as one of the problems we are facing today in the gaming market is scalper or people or groups buying out all the stock of these gaming consoles and creating an artificial scarcity and selling them for way higher price than MSRP or also known as Market Sale Retail Price. Many channels where one can purchase these gaming consoles like the Xbox Series X or even the Oculus Quest 2 are marked sold out due to these scalpers because they are taking advantage of the global chip shortage due to Covid. This solution deters scalpers because it limits 1 purchase for the customer per approval of the credit check, and reduces profitability has the subscription is attached to the order of the account. This “Quest to Success” program will target people with a more limited or constrained income where they can’t afford to make a big purchase at once and will be marketed through social media sites like Instagram, Facebook, emails, YouTube and from our partnered channels like Best Buy, Amazon, and Newegg. We can measure success by examining the data from our KPI’s showing us how many of our customers who apply get approved and how many of those approved customers carry through with the purchase from our program. We can also measure success from data gathered from surveys from our Oculus Gamerverse surveys and data we get from our partnered channels. Our message will be somewhere around the lines of “Anyone can now afford to join the Oculus platform with our new Quest to Success program via 24 to 36 monthly payments! Click here for more info”. If the customer chooses the 24-month plan than it will cost them $22.50 a month and if they choose the 36-month plan it will cost them $18.30 a month. When their Gamerverse subscription ends they will lose access to the game library and won’t be able to play the games they were playing. In conclusion, my idea is to create a game library subscription called Gamerverse and create a program called Quest to Success where the user after getting approved from a credit check can make monthly payment to own an Oculus Quest 2 VR headset and enjoy games from the Gamerverse game library subscription throughout the monthly plan they signed up for. Thus, making it more affordable and cheaper to own and join the Oculus Quest 2 platform.
Part 2:
Oculus has a login with Facebook feature for its account login on the site, but I didn’t see any share buttons from my browser for any of its products like the Quest 2 or accessories. This Facebook Login can create more convenience and ease to login to your Oculus account and is a requirement on the actual device to get started. There however are social channels listed on the footer of the website. Oculus doesn’t highlight any social content from other platforms on their website. All of their content for Oculus is solely from the website and no outside channels. Oculus does have a social strategy to engage with consumers via Instagram, Facebook, and Amazon via the questions asked and answered section. As I previously mentioned in the last assignment, I think Oculus can benefit and build a community and engage more directly with their community if they have an Official Discord, or Reddit that they promote on their website, add their social content and displaying it on their site. Oculus uses Instagram and Facebook to promote their product and engage with users. It seems like most of Oculus’ engagement is from outside the Official website, though they do have some places like blogs where users and comment and engage in their website. Most of their social engagement consists of promoting their products and try to convince customers to buy, promoting new games that come to their platform, and engaging with customers about their thoughts and feelings about these new releases and deals around their platform.
Wire-frames:
Final process:
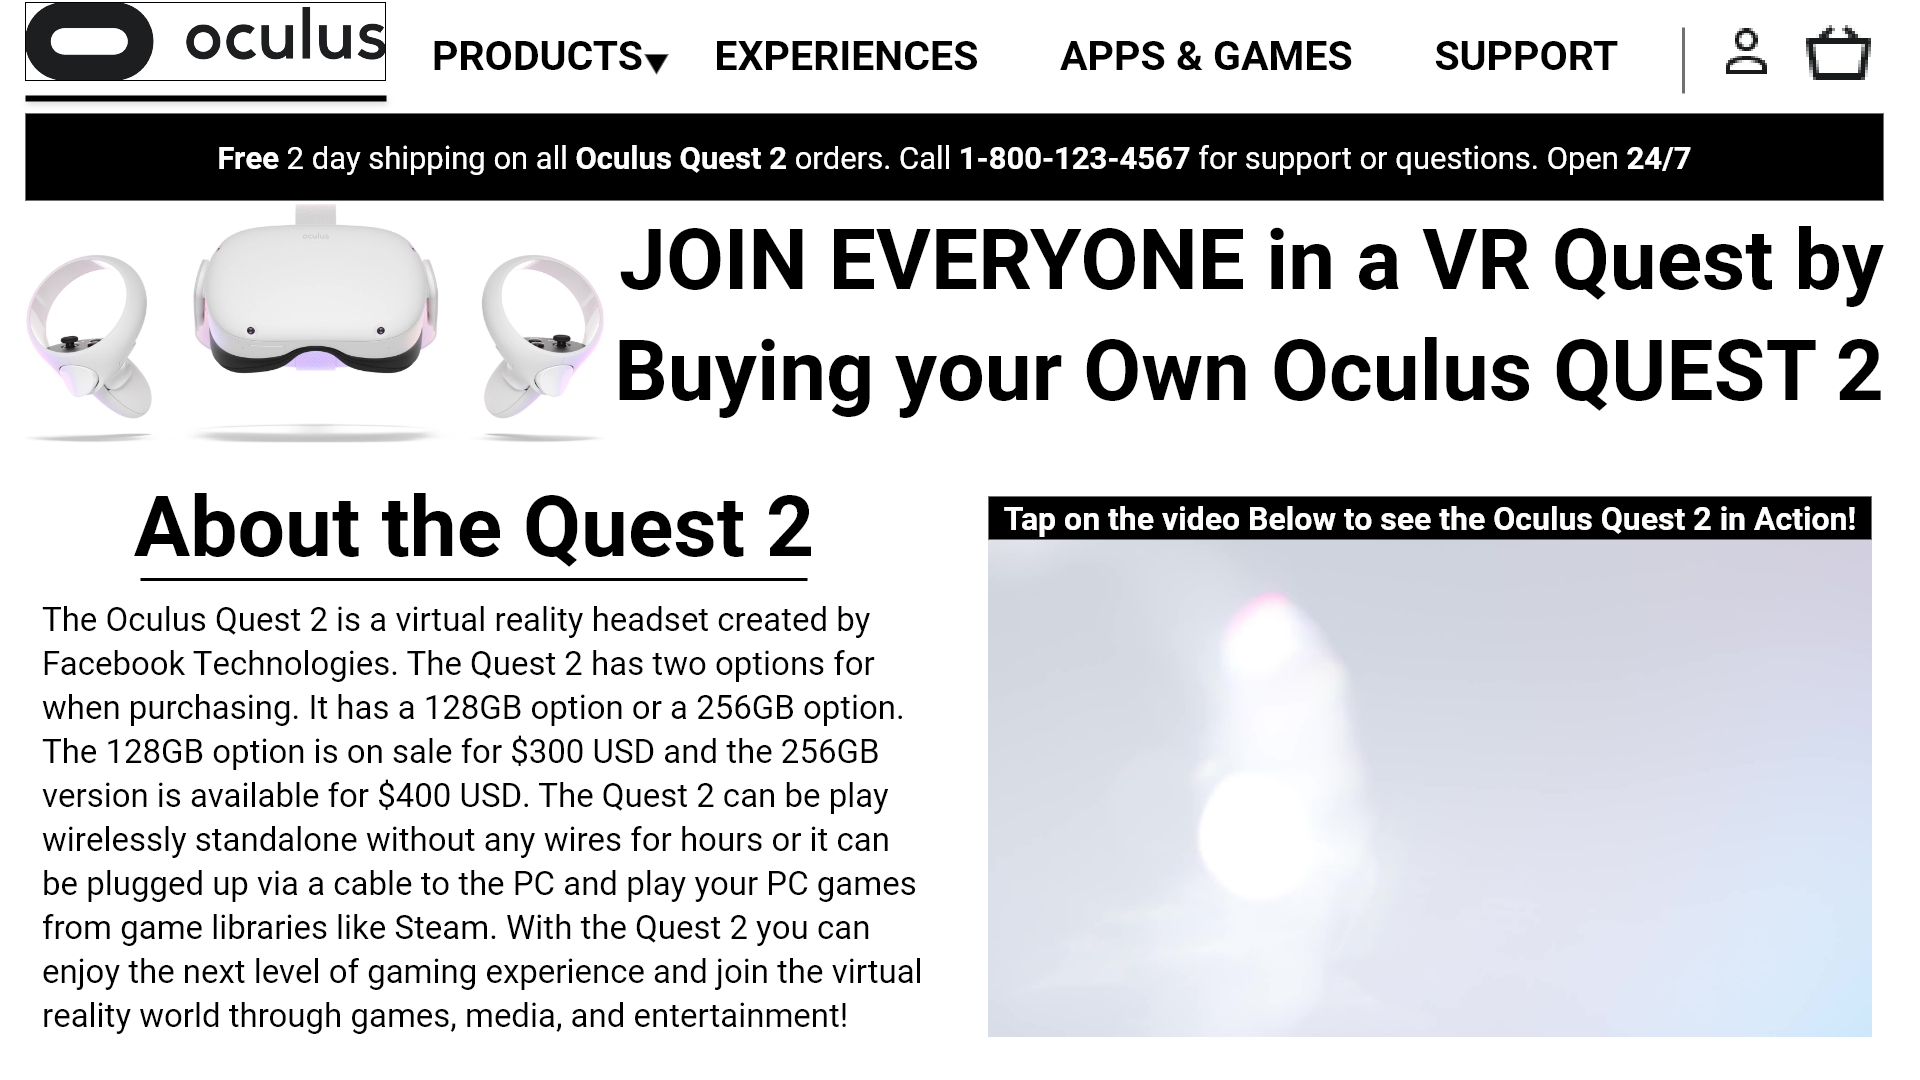
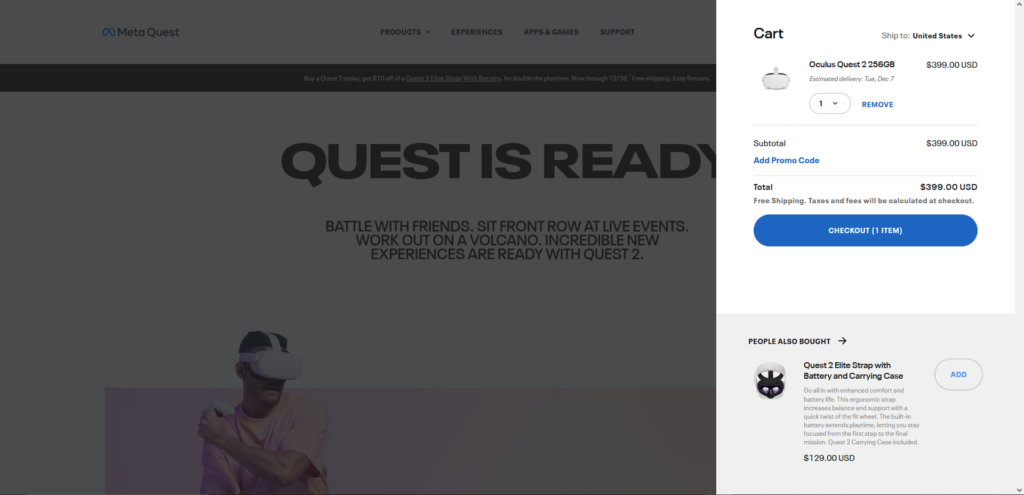
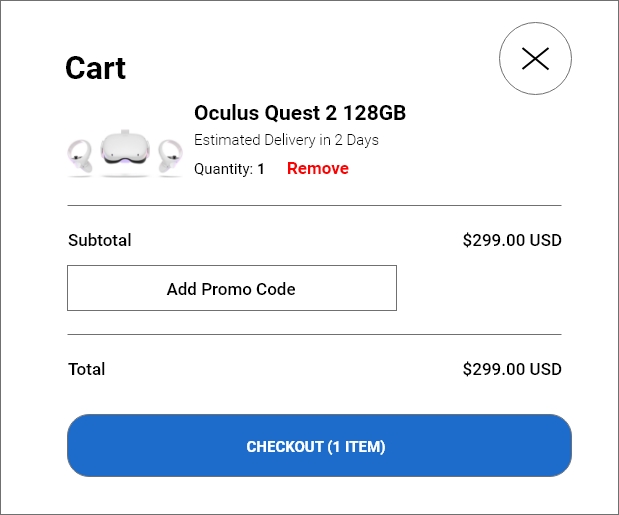
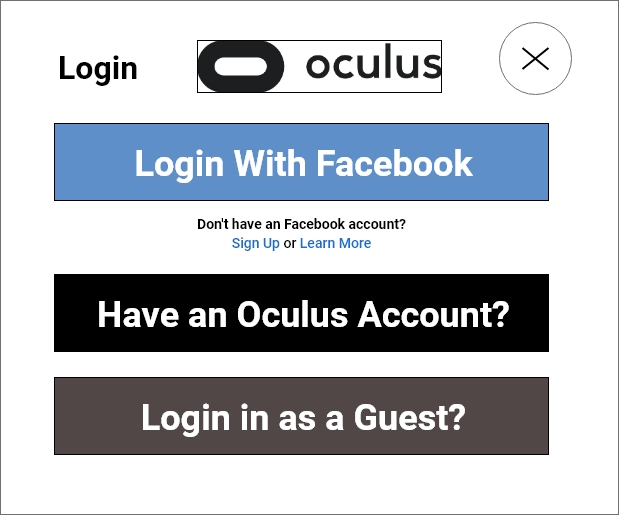
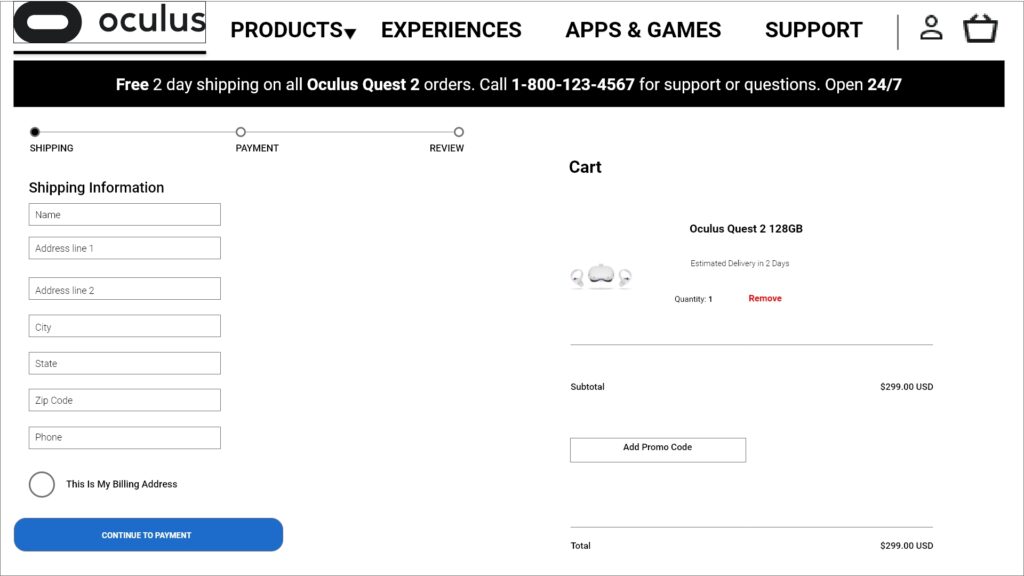
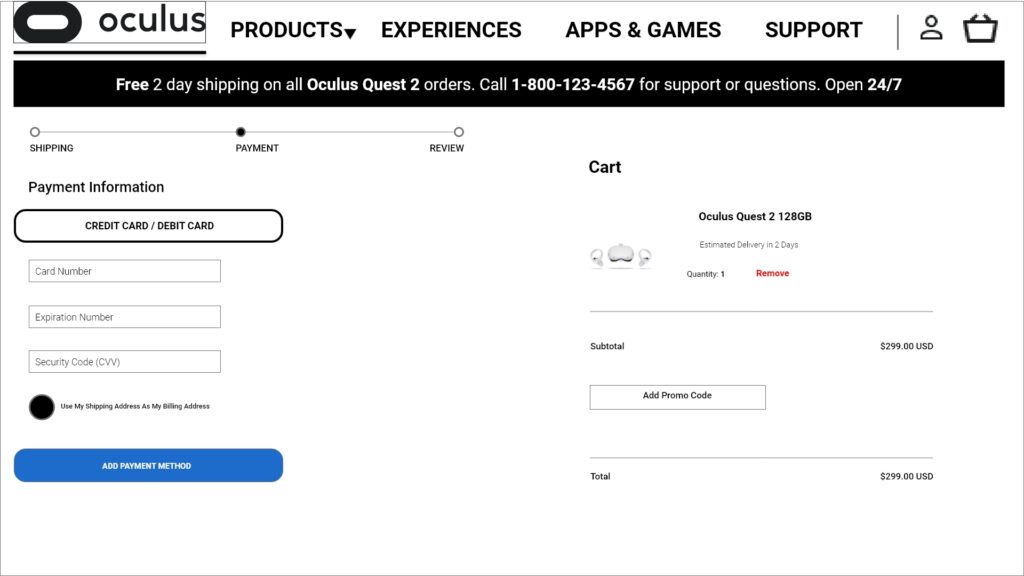
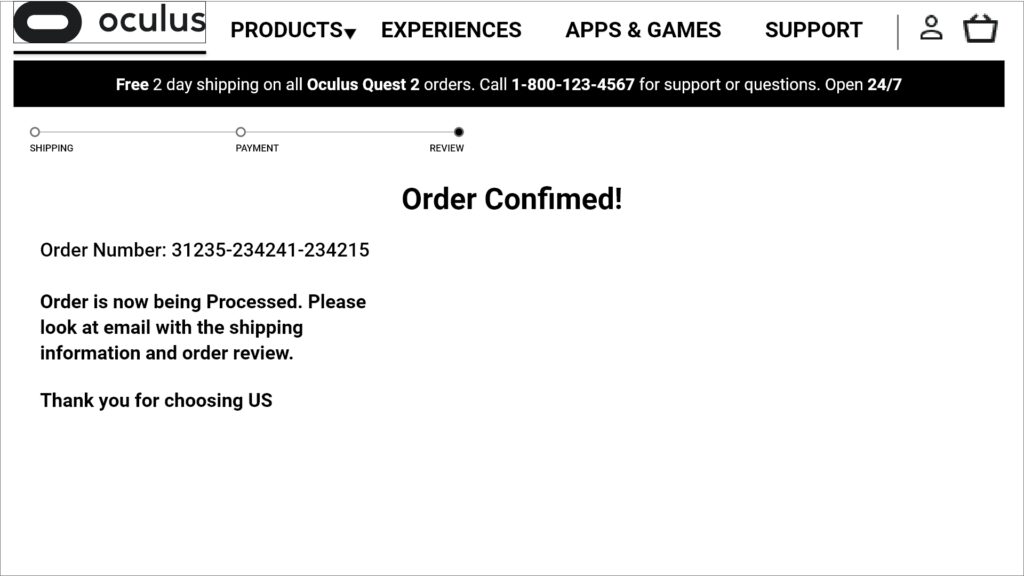
For the wire-frames, I wanted to stay true to the Oculus color scheme of black and white because I think it shows how they want to make their products seem simplistic and intuitive like the Apple website and have that modern clean-cut look. Using XD however I learned how to do many things like creating overlays and used them to create an overlay when clicking on the cart and account icons in the top. I like the use of having these popup overlays and not having to wait for a screen to load or keep on switching back and forth from pages, so I thought other users might appreciate that as well. I was surprised to see Oculus didn’t do that for their account icon like I did. For the process of designing the front page I added contact info on the top below the nav. I thought this was a good way to show trust to a user to purchase from us. As for the content in the front page, I added a video about Oculus and info about Oculus so customers who are new or interested but want to know more about the new Quest 2 virtual reality headset can learn key info quickly and get a look of the Quest 2 in action. Oculus has many pictures and then some videos later in their page of the product, but I think customers will just want to see how it looks and works right off the bat, so I thought having a video right when you load up the front page was nice and quicker for consumers to see content in a simplified consumable way straight from the beginning. I also added a photo of the Quest 2 as a standalone instead of someone with it because the video covers that aspect of the product and I’m sure customers will want to see the product itself. I decided to have text on the left and video on the right. As for the login screen, I added a guest login for people who don’t want to login via Facebook as that was a big concern for people in the gaming community that was outraged and concerned about their data being leeched from Facebook since Oculus is owned by Facebook as well and new users were forced to sign up or login via Facebook which angered many as they either didn’t trust, use, or like Facebook as the only login method. If you were an older user who made an account before Facebook bought out Oculus than you had an Oculus account and could login that way so I had to add that option. As for the checkout process I also added a overlay popup when clicking on the cart as I stated before I like not having to load to a new page and switch back and forth. Then from that overlay it is transitioned into an actual page where one goes through the normal checkout process. I added links to the breadcrumbs on the checkout process so users can go back and edit anything if they needed instead of having to restart the process like certain sites make you do if you click back. Then lastly I made sure all the pages have been linked to the correct place like the pages before like the cart, account, and breadcrumbs. In the end this is what I ended up with.
